How can you trust something you don’t fully understand?
And why assume that it actually works?
These questions are rarely asked directly, but they are almost always there in the background when someone first encounters what we are doing.
We don’t disclose everything, and to be fair, we don’t think everything needs to be disclosed. In practical terms, results tend to speak louder than explanations. Still, there are a few points worth sharing.
How systems are usually evaluated
When people try to assess a trading system or a trader, they typically rely on a familiar set of metrics: Profit Factor, Risk-Reward ratio, drawdowns, Sharpe ratio, equity curve smoothness, and so on.
These are useful tools — but only to a certain extent.
If you look at real-world trading over longer periods, it becomes clear that even experienced participants who actually make money don’t consistently fit these “ideal” criteria.
More importantly, most evaluations are retrospective. A system is called “good” only after it has already produced results.
The same approach, using the same instruments and rules, can deliver very different outcomes shortly after — sometimes significantly worse. This is not unusual; it’s something most traders have experienced.
At the same time, what actually works in practice is often labeled as “suspicious” simply because it doesn’t align with clean theoretical expectations.
Which creates a bit of a paradox.
A simple analogy
Imagine a weather forecast: “Tomorrow at 14:00 it will be 21°C, clear skies, light wind.” The model worked perfectly yesterday under similar inputs, so we trust it.
But reality turns out differently: 12°C, strong wind, rain.
Is the model “wrong”? Not necessarily. It’s just that the system itself is dynamic. Sometimes it behaves similarly to the past, but often new conditions emerge.
Markets are even more complex in that sense.
Where the real difficulty lies
Most evaluations in trading describe the past but offer limited insight into the future.
In our case, the system currently behaves better than what conventional expectations might suggest. Naturally, this creates skepticism — especially if one relies on traditional ways of measuring performance.
But metrics themselves are simplified representations of reality. They tend to work reliably only under certain conditions, and often only in hindsight.
The main challenge is that retrospective evaluation doesn’t necessarily translate into forward understanding.
On probability
That said, there is one concept that remains fundamentally important: probability.
However, it only becomes meaningful when applied to sufficiently large samples — hundreds or thousands of observations.
This is why the focus shifts away from individual trades and toward distributions and aggregate behavior.
From this perspective, the question becomes relatively simple:
If a system demonstrates a statistically significant edge, can that edge translate into stable outcomes over time?
This is not a claim. It’s a working hypothesis.
And this is exactly what we are exploring — openly, step by step, based on real data.

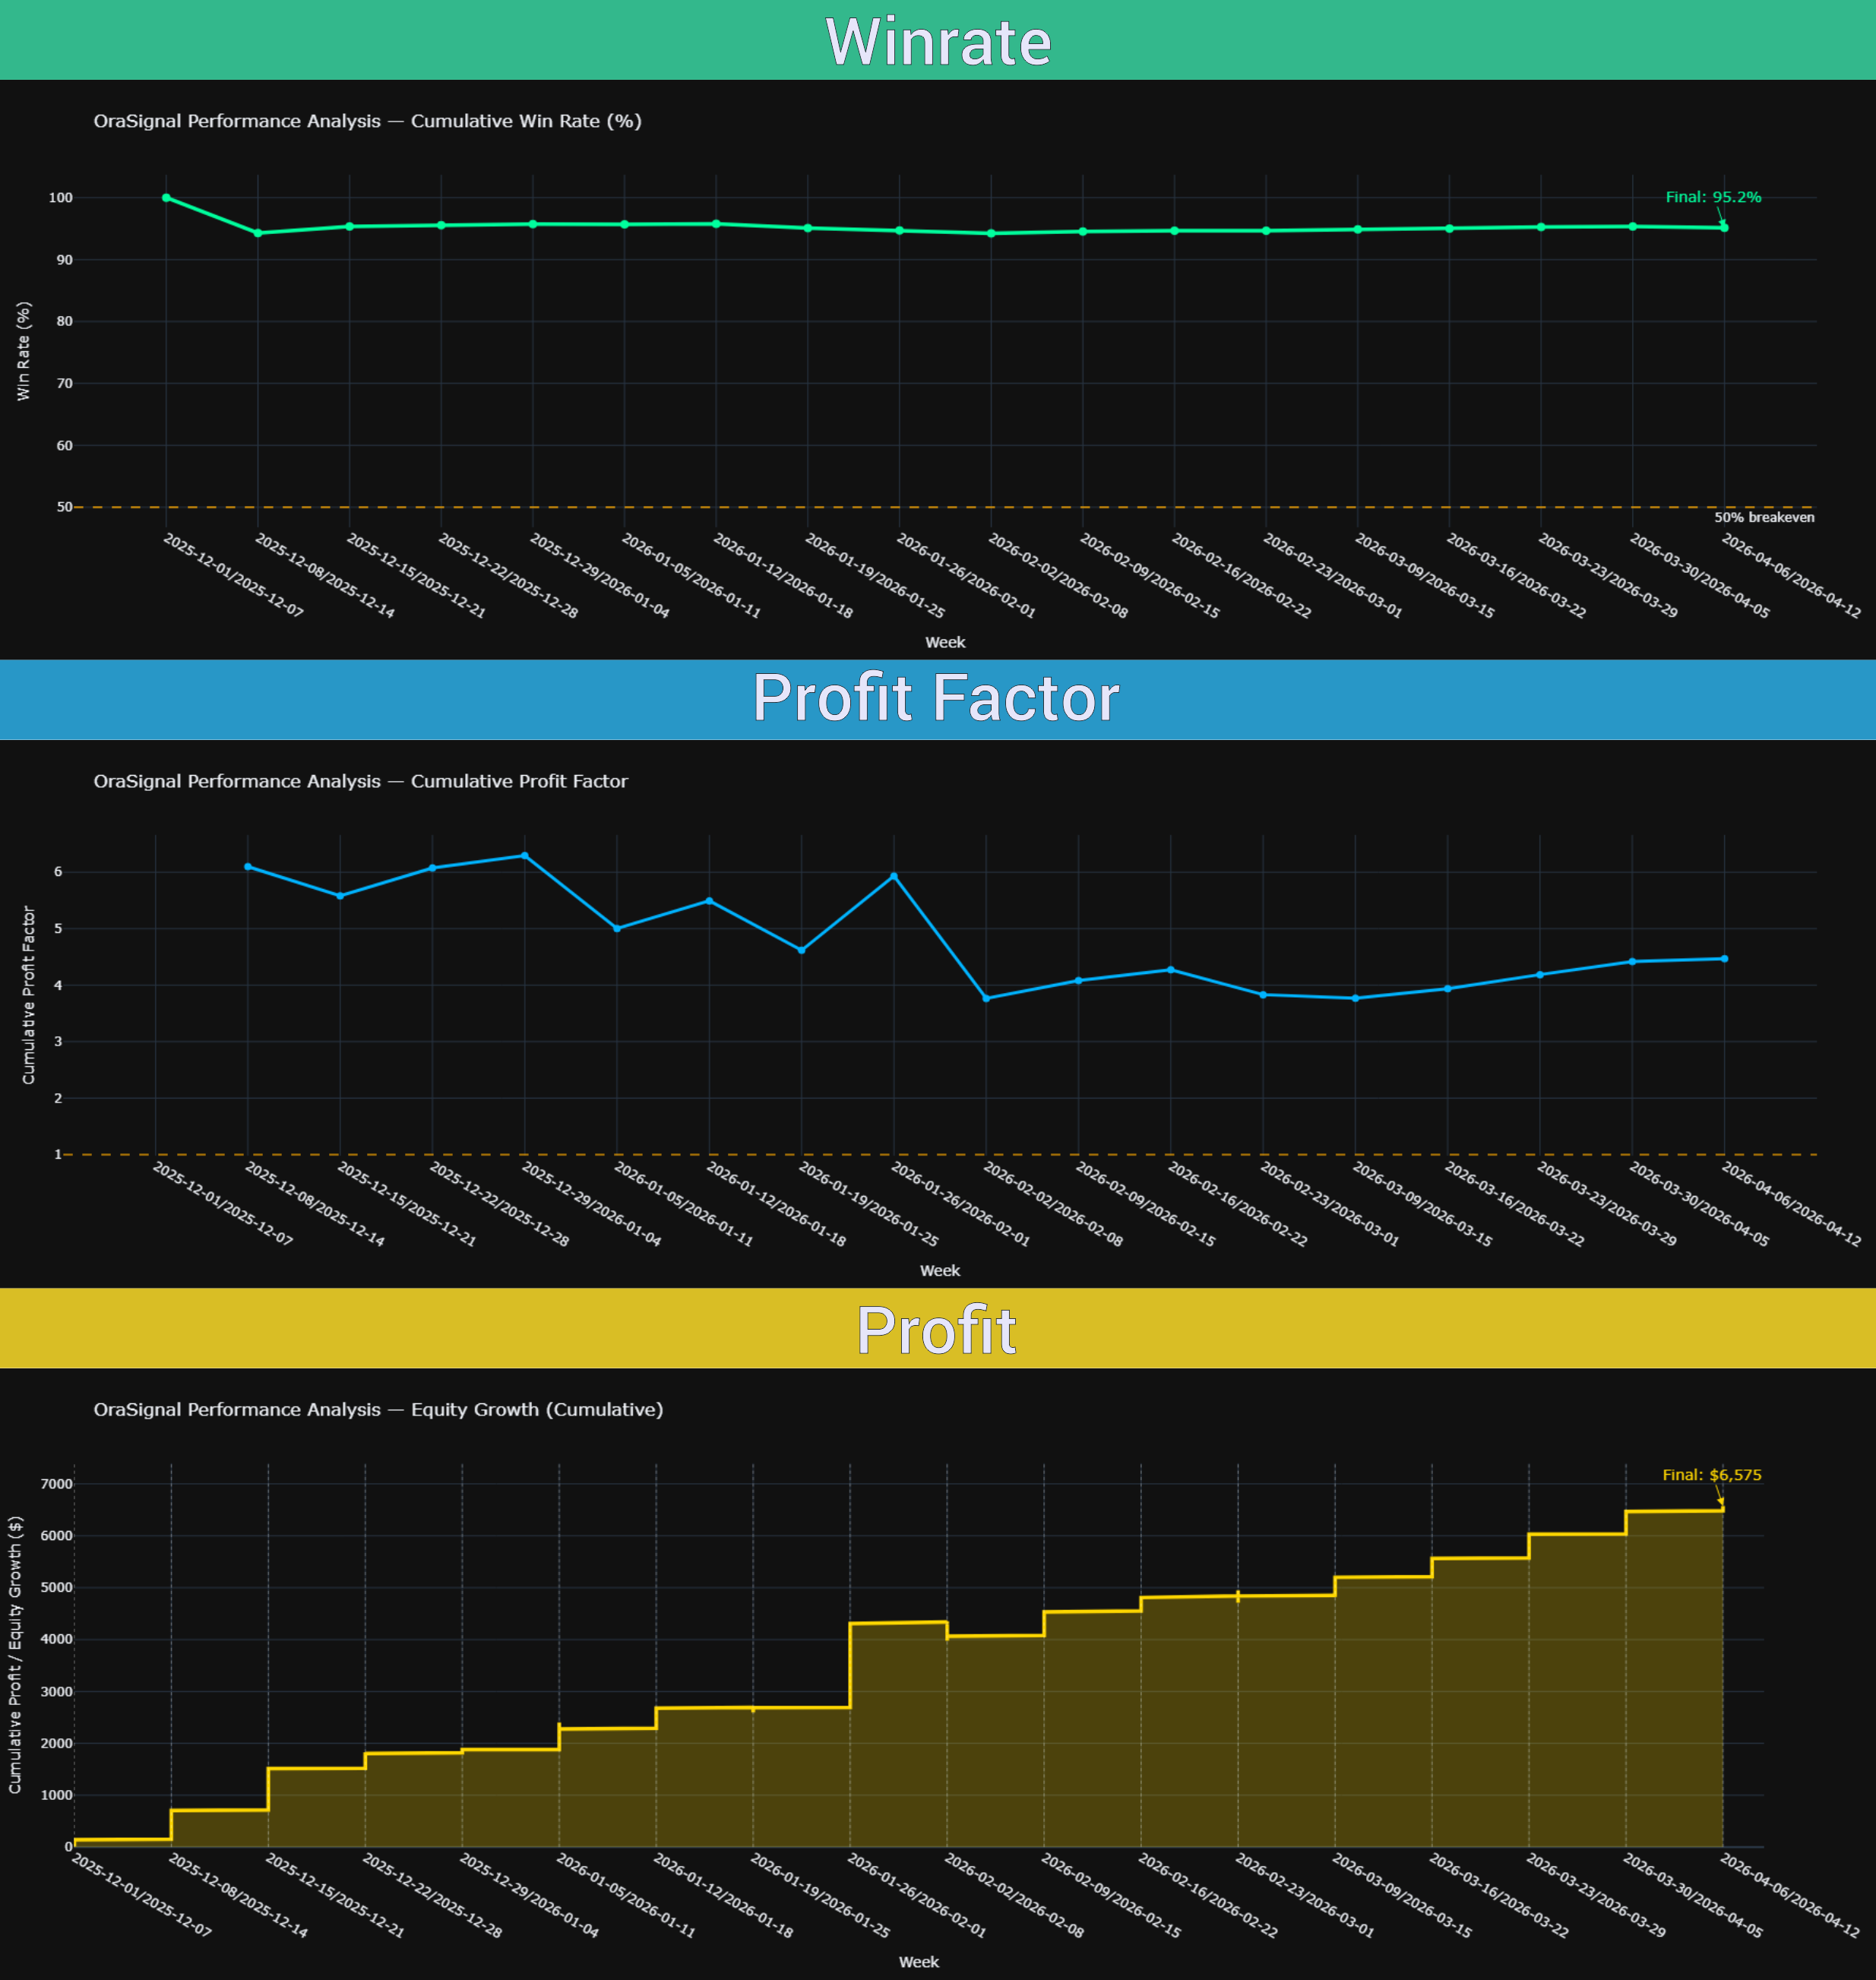

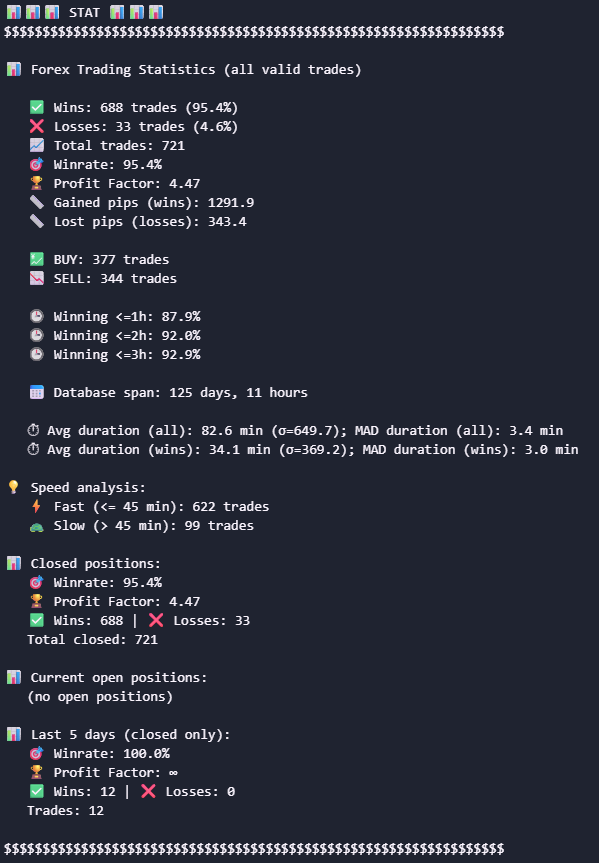
When we look at our system, what we see is, at the very least, unusual.
The key metrics — the same ones that are typically evaluated only in hindsight — show a high degree of stability over time.
Win rate remains consistently in the 92–95% range, and across the full dataset (tens of thousands of trades) it stabilizes around ~91%. Profit Factor stays above 2.5 on a sustained basis (in practice often higher, though we prefer to remain conservative in how we present it).
In other words, the behavior we observe is closer to what one would ideally expect from metrics — relative stability over time, rather than constant degradation or drift.
At the same time, we pay less attention to metrics that describe the micro-structure of individual trades. Take MAE, for example. In a system as dynamic as the market, local fluctuations can vary significantly even when the overall structure remains consistent.
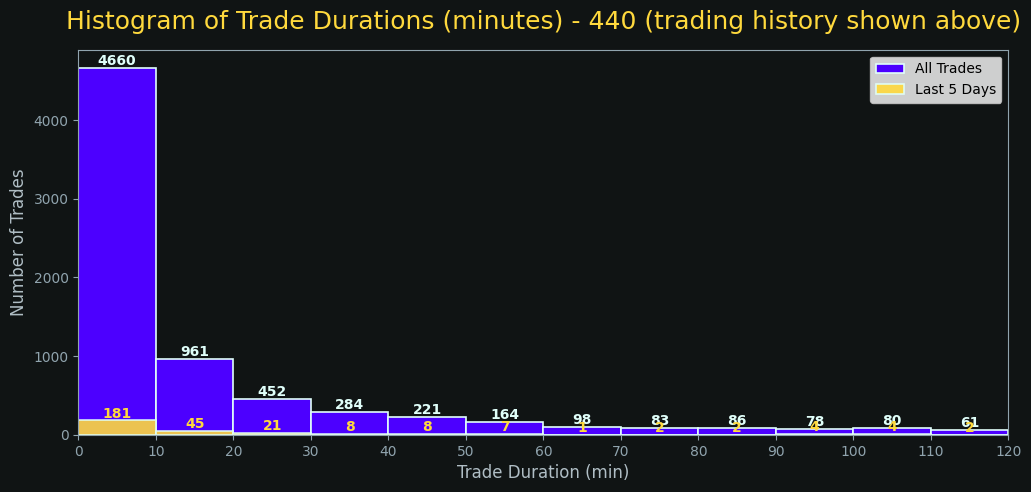
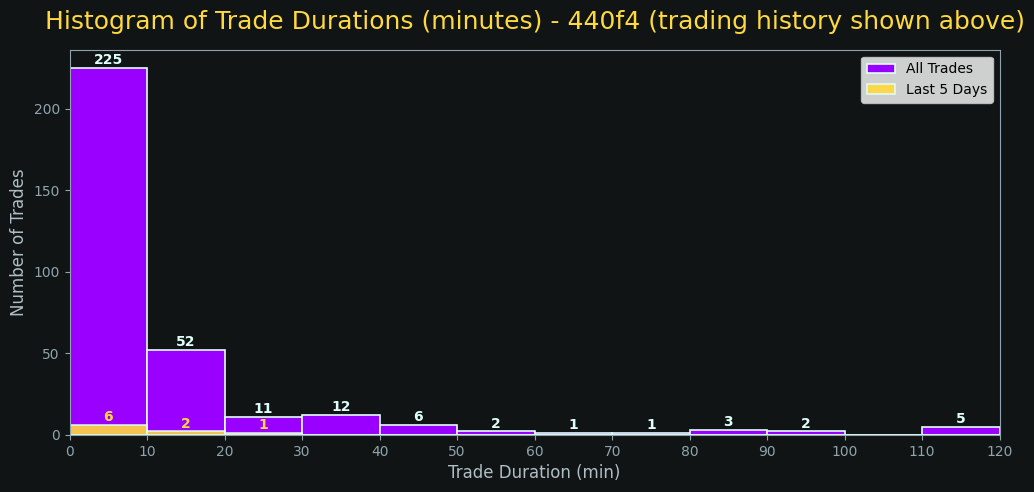
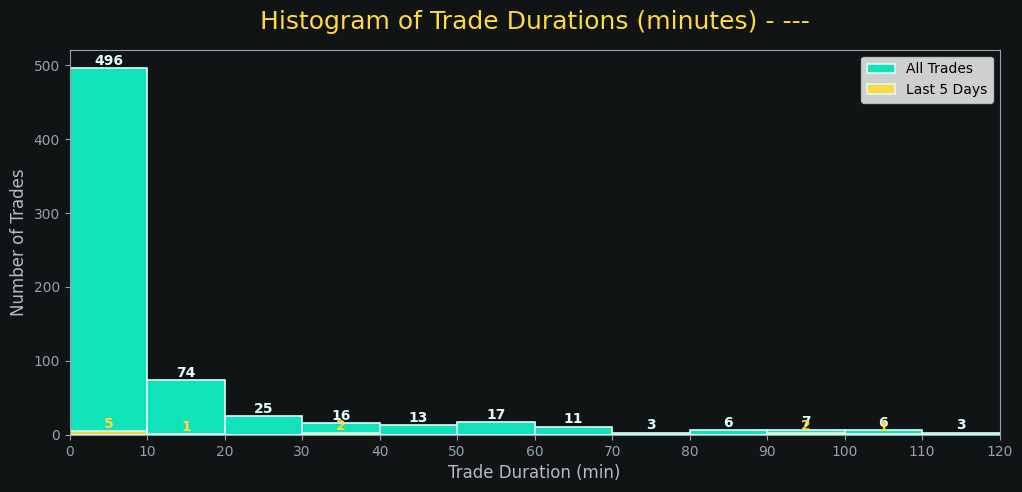
Instead, we focus on distributional behavior. In particular, time-based characteristics of trades.
If the system captures something real, one would expect most trades to resolve relatively quickly, with a smaller portion extending over longer durations.
This is exactly what we observe: a clear asymmetry in the distribution, with a strong concentration in the early intervals and a gradual tail.
It is not a perfectly symmetrical Gaussian distribution — and that is precisely the point.
Such asymmetry is more consistent with real market behavior. It suggests that outcomes are not evenly distributed in time, and that the system reacts differently depending on how the underlying movement unfolds.
Importantly, this structure appears stable across samples. Not rigid, not deterministic, but persistent enough to be measurable.
From our perspective, this is one of the signals that the system is not operating in a purely random regime.
In conclusion
For us, the primary criterion is not perfection, but stability at a certain level.
Explanations, interpretations, and theoretical framing are always secondary. They may be useful, but they do not define the outcome.
What matters is that across repeated observation windows, the system continues to produce comparable statistical characteristics.
Why this happens is a separate question.
We have working hypotheses, of course, but not everything can or should be formalized at this stage.
What can be stated more confidently is that the observed behavior does not fit neatly into conventional expectations — which naturally leads to skepticism.
And that skepticism is understandable.
Most frameworks in trading are built on past experience, and they tend to interpret anything outside those boundaries as either unstable or unreliable.
But frameworks are just that — frameworks. They are useful, but not absolute.
For us, the priority remains unchanged: a sufficiently large sample size, consistent numerical results, and reproducible statistical structure.
Everything else follows from that.