As mentioned earlier, our primary background is not trading, but construction engineering. This is exactly why our perspective on markets — coming somewhat from the outside — may be both different and, we hope, useful. And here’s why.
In engineering, the central principle is responsibility.
Any statement, assumption, or conclusion must be grounded in calculations performed in strict accordance with established standards and frameworks.
The reason for this is quite straightforward.
Errors, inaccuracies, or careless reasoning carry real — sometimes critical — consequences. This is not an exaggeration. We are constantly surrounded by engineered structures, yet we don’t question whether the floor will collapse or the ceiling will fall. That confidence exists for one reason: everything has been calculated.
In serious engineering, there is no room for guesswork, loose assumptions, or purely intuitive decisions. Such approaches are simply not acceptable.
So why doesn’t your house fall down?
The answer is simple: mathematics and physics work.
In other words, ideas, arguments, charts, and even well-structured reasoning are not enough on their own. Without calculation, without real-world validation, without empirical evidence, they remain just opinions — and do not reflect the actual nature of the processes they attempt to describe.
How did trading communities turn into endless discussion clubs where, out of hundreds of statements made in a short period of time, not a single one is supported by verifiable evidence?
I hope the reader understands what this actually implies.
It means that any statement with a strong claim but without factual validation of real-world performance is essentially meaningless. A form of graphical or verbal abstraction — just symbols, words, or lines without empirical grounding.
The question is: why should anyone spend time on that?
Or is there still a belief that simple geometric representations — lines, rectangles, triangles — automatically gain validity just because they belong to mathematics, and therefore are assumed to “work by default”?

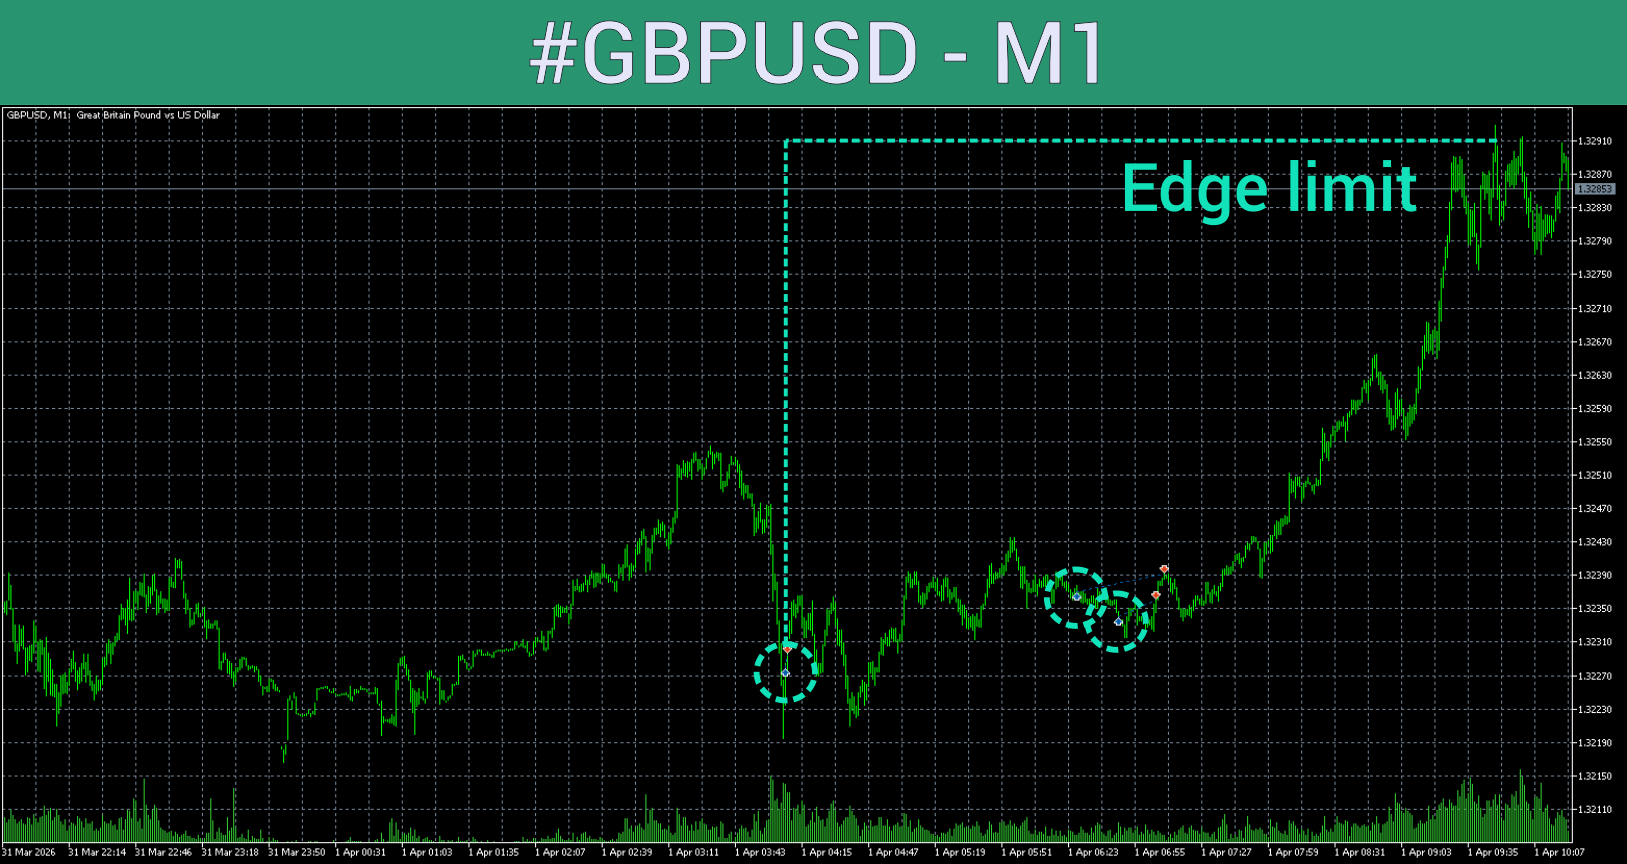

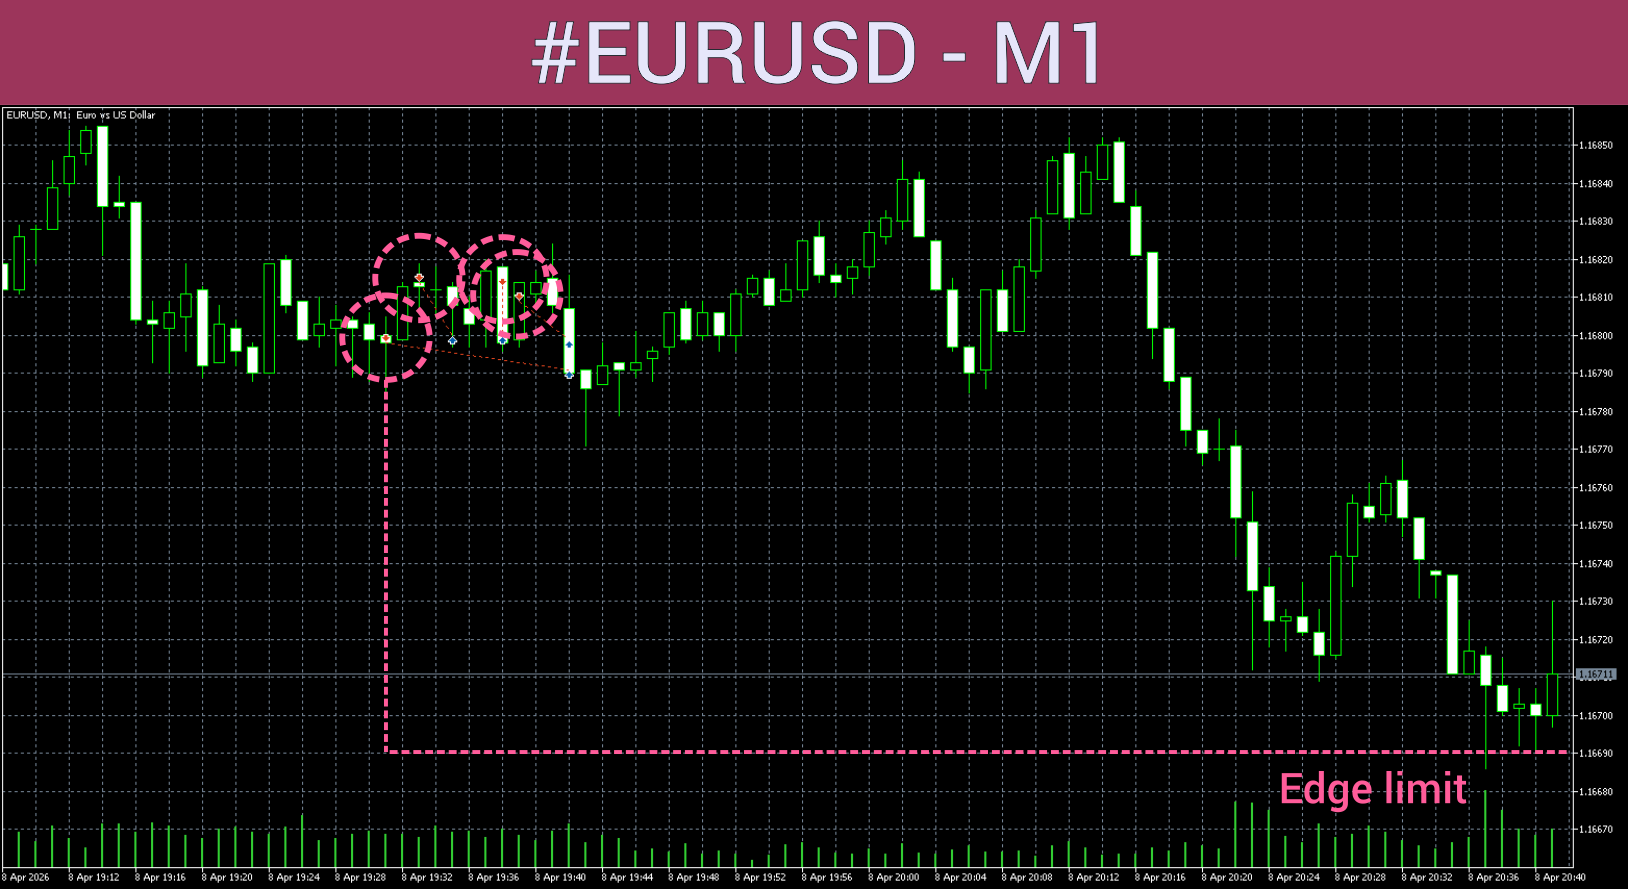
It is important to understand: the market is an n-dimensional structure.
Hundreds and thousands of factors — geopolitical, economic, behavioral, and many others — interact within a highly multidimensional space. Attempting to describe such a system using lines, planes, or simple geometric projections is similar to analyzing ocean dynamics with a ruler. The scale of abstraction is fundamentally mismatched.
There is no intention here to criticize or diminish anyone’s work. On the contrary, the goal is simply to highlight the limitations of time spent on models that may not fully correspond to the underlying reality.
A formula, a geometric shape, or a sequence of numerical outputs does not automatically make a strategy mathematically validated in a practical sense. This only becomes meaningful once a specific claim is consistently confirmed in real-world application.
For example, many studies suggest that technical analysis may provide a modest statistical edge — often estimated in the range of 5–10%. In practical terms, a random entry would correspond to a 50/50 distribution, while a simple heuristic improvement might shift this toward ~55–60% accuracy under certain conditions.
However, even in such scenarios, a small number of adverse outcomes can significantly impact overall performance. A few unfavorable trades in a sequence can offset a large portion of prior gains, especially when risk is not properly controlled.
From this perspective, the limitation is not in the presence of an edge itself, but in its stability and its interaction with risk dynamics over time.
I do not want to overextend this point, but from an engineering perspective, the gap between theoretical assumptions and practical outcomes often appears significantly underestimated.
If we were to apply similar reasoning in construction engineering, the consequences would be immediately obvious. Yet in trading, these assumptions are often treated as acceptable simplifications, even when the underlying risk structure is far more sensitive.
And yet, in everyday life, we rely on engineered systems with implicit trust — without actively considering the complex forces and safety margins that make this stability possible.


And here is the central question: by what criteria should we evaluate the quality of trading decisions? How do we assess the performance of a system — or our own AI — in a meaningful way?
The answer, in its most basic form, is straightforward: statistics. At a minimum, we rely on fundamental metrics such as win rate and Profit Factor.
Occasionally, when we publish AI-generated results, we encounter reactions like: “Why is it so simple? Surely it cannot be that simple? Where are the multiple layers of indicators, geometric constructions, and complex visual structures?”
Without these, some people feel there is nothing to interpret. The question is often raised: how can it be that a position is opened, closed in profit, and that’s the entire story?
At this point, one natural question arises: why should it be complicated in the first place?
Of course, the process of forming an expectation or evaluating a potential market direction can be complex, structured, and multi-layered. However, the outcome itself must remain strictly simple. Either the decision was correct, or it was not. A binary evaluation: TRUE or FALSE.
And yet, despite this simplicity, such clarity is rarely presented directly. Instead, we often see extensive visual constructions and post-factum interpretations that make it difficult to understand what actually happened.
This is why, when looking at large collections of charts and analyses, it becomes unclear whether we are observing genuine forward reasoning or simply retrospective explanation.
Ultimately, the final evaluation should remain simple. No matter how complex the reasoning process is, the result reduces to one question: did it work or did it not?
Without this clarity, further interpretation loses practical value.

And here we arrive at another important point that naturally follows from everything discussed above.
In your opinion, what should an ideal trading strategy, system, or AI look like? What exact and objective criteria should it satisfy? Which numerical results would actually be convincing to you personally?
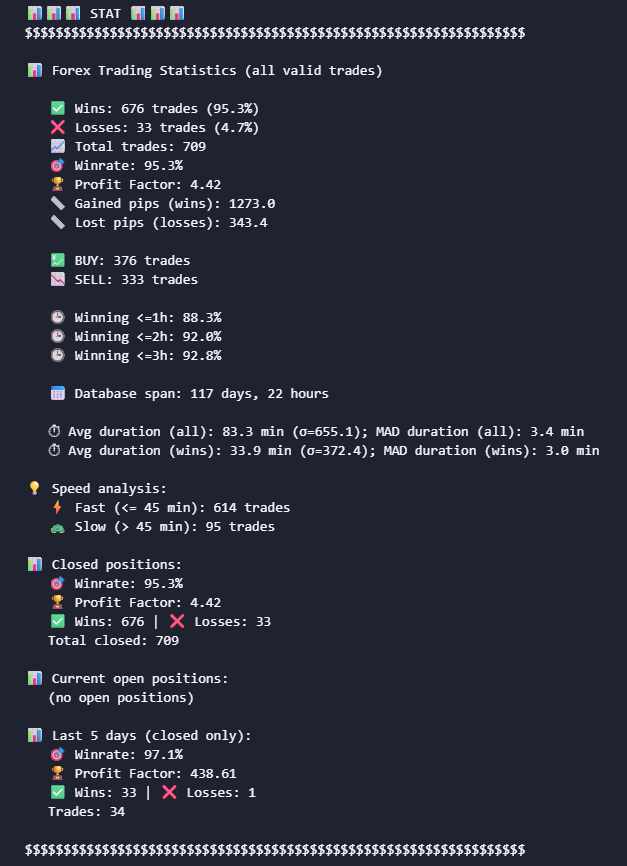
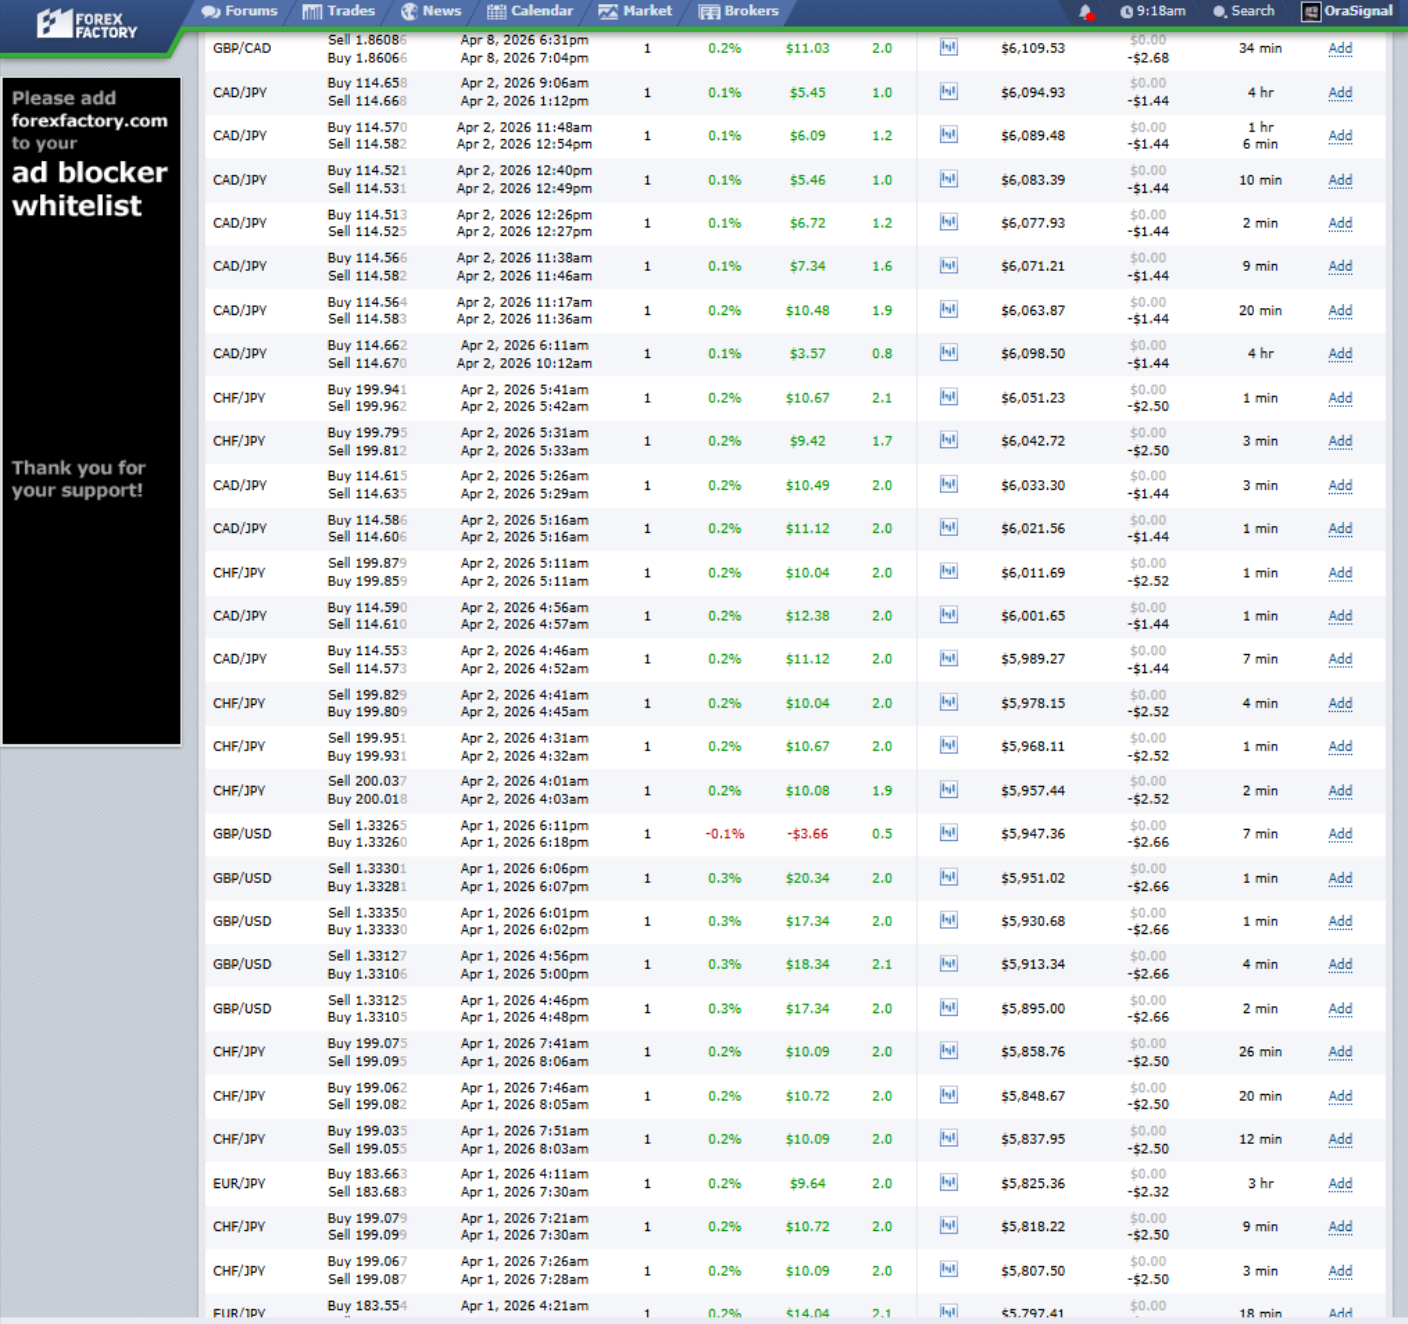
For the past six months, we have been publishing our statistics publicly. Not in the form of decorative charts or complex visual constructions, but as structured and verifiable numerical data.
The core metrics are simple:
- Win rate: above 90%
- Profit Factor: above 2.5 (in practice higher, though we keep a conservative estimate)
In addition, all executed lots and AI-generated decisions are transparently recorded.
And yet, the reaction remains an interesting observation in itself. We openly publish signals that are statistically validated and consistently evaluated…
Do we have 100,000 subscribers? No. Do we receive hundreds of comments or wide public attention? Also no.
This naturally raises a question: why do many market participants tend to overlook precisely those metrics that institutional investors typically consider essential?
To clarify our position — this is not a question of attention or popularity. The system develops independently, and its internal progress is not dependent on external validation.
The core issue is not whether someone “believes” or not, but why verifiable numerical evidence is often ignored in favor of subjective interpretation. Yet in practice, these numbers are the closest thing to an objective reference point in evaluating performance. This is exactly how serious capital allocators approach decision-making.
And this is also how we evaluate our own system — or more precisely, the AI-driven component of it.
It can be viewed as a form of automated research engine with performance-like characteristics: each decision either produces a positive result or does not.
As of today, the aggregated result remains consistently positive.
In practical terms, it reduces to a simple observation:
ENTRY → EXIT → POSITIVE OUTCOME. WITH A CONTROLLED AND STRUCTURED RISK PROFILE.
And fundamentally, this is all that is required to evaluate both an individual decision and the aggregation of all decisions over time.
Everything beyond that becomes interpretation — sometimes useful, but often disconnected from the actual mechanics of the system.


And perhaps it is worth addressing one more fundamental topic — the question of guarantees.
This is a broad subject, and we will likely dedicate a separate article to it. However, even in a condensed form, it is important to mention it here.
In this context, we are referring to the guarantee of performance.
As engineers know very well — and as is often overlooked in other domains — even a house, despite all structural calculations and safety margins, is designed with a finite operational lifetime in mind (typically several decades for residential construction). In other words, even when a system is designed according to strict physical laws, its stability is not infinite.
Over time, any structure degrades.
Without going deeply into thermodynamics or entropy theory, the simple conclusion is that nothing is permanent, and absolute guarantees do not exist in any real system.
Even a warranty on a device is not a guarantee that it will never fail — it is merely a guarantee that it will be repaired or replaced under defined conditions.
This already gives a slightly different perspective on what we usually call a “guarantee,” doesn’t it?
That is why standard disclaimers such as “no guarantees of results” are formally correct, but somewhat incomplete in meaning. The deeper interpretation is simple: no system in reality can provide absolute certainty about future outcomes. This is a structural limitation of the world itself.
Everything eventually decays or changes state over time. Without excessive dramatization, this is simply a practical observation about long-term uncertainty.
Returning to the main idea: if absolute guarantees are impossible, then the question becomes how we distinguish higher-quality systems from lower-quality ones.
The answer is likely already familiar.
We are left with a single reliable tool: statistics, performance metrics, and — most importantly — their stability over time, within natural variance.
The more consistently a system performs over a long period, the more likely it is that it reflects a stable underlying structure rather than random fluctuation.
That is the core idea.
If one chooses to engage with any system, knowing that no 100% guarantees exist, then it is rational to prefer those that demonstrate repeated, stable behavior under real conditions — delivering outcomes that remain consistent over time.
Not a short-lived sequence of success, and not isolated periods of performance. Those are insufficient.
What matters is sustained behavior across months — and ideally years — with expected variance but persistent positive expectancy.
We are not claiming that our AI is definitively such a system.
Not yet. Or more precisely: statistically, it currently behaves in that direction. However, we continue to test it continuously, and in principle this process never ends — it is an ongoing cycle of adaptation and validation.
What we can say with confidence is that, so far, we have not encountered comparable publicly available performance consistency elsewhere (based on our own research and external discussions).
And that, in itself, is a strong motivation to continue :)