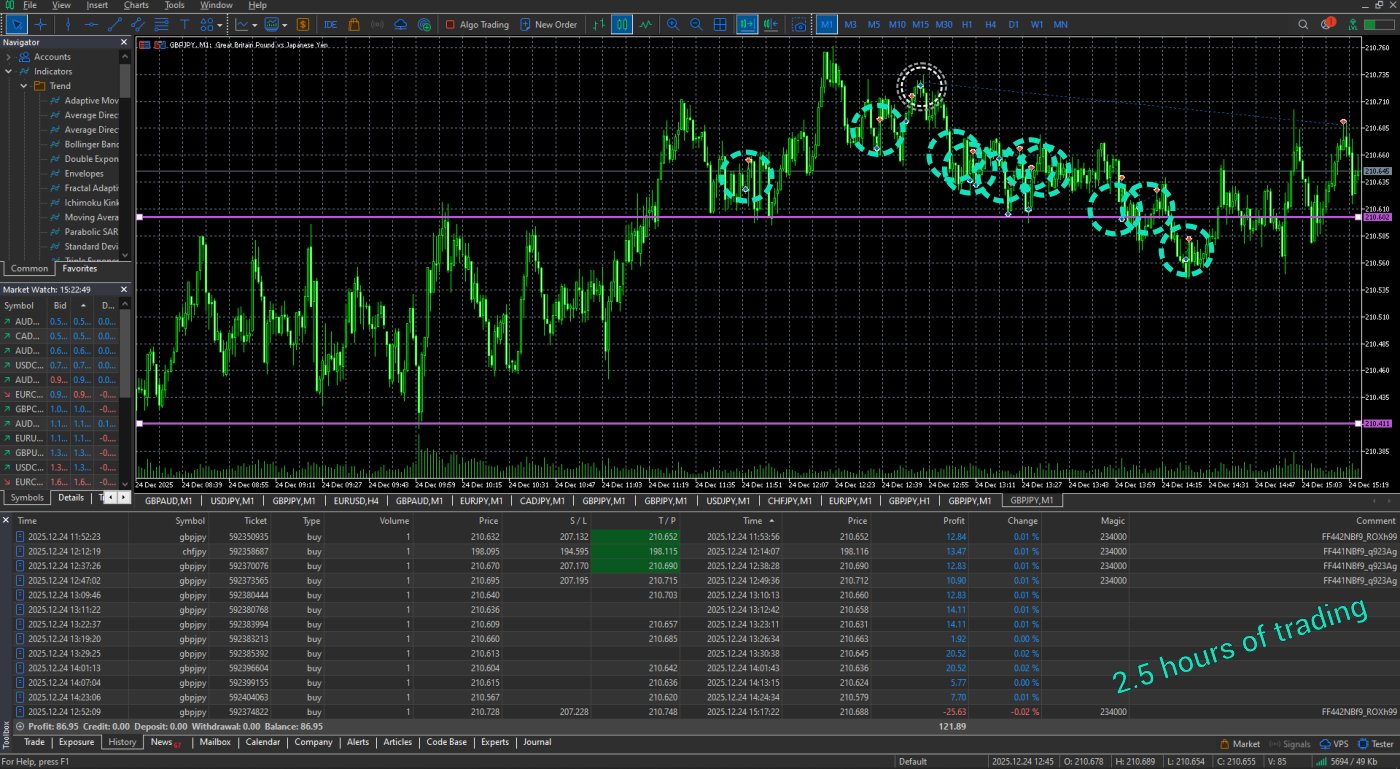
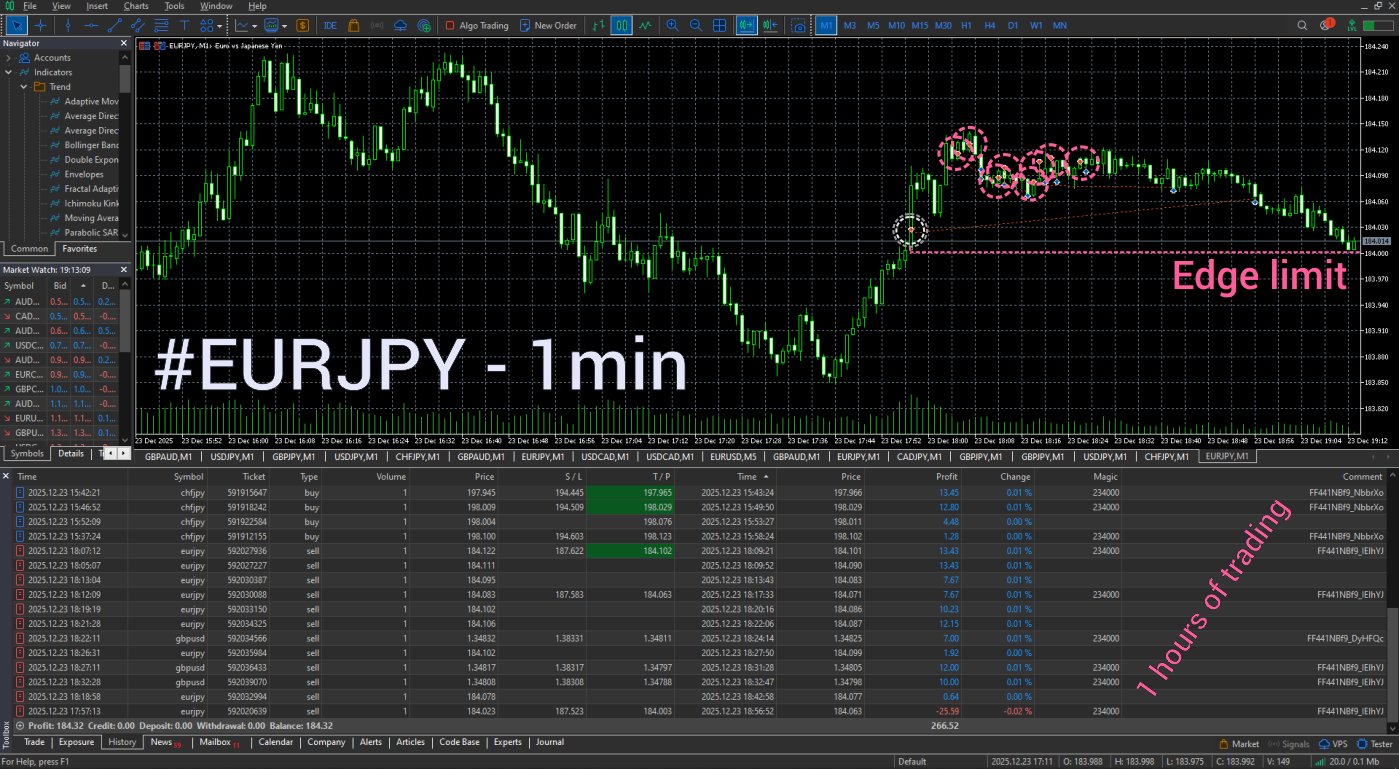
The First Criterion: Win Rate
We begin with what we consider the most fundamental diagnostic metric — the win rate, defined as the proportion of correctly predicted directional outcomes.
When evaluated honestly over a sufficiently large sample, win rate reveals a critical property of any system: whether an exploitable edge was detected prior to execution, or whether the sequence of decisions is statistically indistinguishable from randomness.
Before each trade, a directional assumption is made. The key question is whether this assumption reflects genuine signal detection — or merely subjective interpretation without informational advantage.
Consider a baseline experiment. If trades are generated randomly — long or short, at arbitrary times, with fixed risk parameters — the long-term outcome converges toward a 50/50 distribution. This represents the null hypothesis of no edge.
Introducing basic rule-based filters or technical indicators may slightly shift this distribution — often by a marginal amount in the range of 5–10%. However, in most cases, the system remains close to the same probabilistic baseline.
It is important to emphasize that this discussion does not concern profitability, but directional correctness. These are distinct dimensions of evaluation.
A coin-flip model illustrates the same principle: heads corresponds to long, tails to short. Over a sufficiently large number of trials, accuracy stabilizes near 50%. Short-term deviations such as 55/45 or 60/40 are expected statistical fluctuations and do not imply persistent skill unless confirmed across large datasets.
Only under conditions of extensive sampling — thousands of observations under consistent rules — can one meaningfully determine whether a system exhibits a statistically significant edge.
This is precisely why disciplined record-keeping, trade journaling, and long-term evaluation are not optional practices, but methodological requirements.
The Reliability Problem
From a strict analytical perspective, the future does not exist as an observable object. Only the present is accessible, while time evolves irreversibly. Any forecast is therefore a probabilistic assumption about the persistence of observed patterns.
This perspective removes emotional interpretation from failure. A loss does not imply error in moral or subjective terms — it simply reflects the inherent uncertainty of the system under observation.
In trading, outcomes are fundamentally binary at the decision level: correct directional prediction or incorrect prediction. While this structure resembles a coin flip, the key distinction is that predictive systems may contain informational advantage — otherwise, markets would reduce entirely to random processes.
Empirical observations suggest that the majority of participants operate at or below random performance levels. However, even a small subset — often estimated between 5% and 10% — demonstrates persistent long-term viability.
The critical question is therefore not whether prediction is possible in absolute terms, but what differentiates systems that consistently maintain an edge.
Not visual complexity. Not narrative justification. Not post-factum explanation.
Only the stability of predictive accuracy under repeated conditions.
Why Win Rate Matters
It is important to clarify that win rate alone does not determine profitability. A single uncontrolled adverse move can invalidate any statistical advantage.
However, win rate serves as an effective filtering mechanism.
Claims of predictive capability without verifiable performance data should be treated as unvalidated hypotheses. Analytical reasoning without empirical frequency of success is structurally incomplete.
Win rate measures how often a system was directionally correct before outcome realization. In this sense, it answers a fundamental question:
Was there informational structure — or only interpretation?
Certain approaches, such as trend-following, may operate with relatively low win rates while maintaining profitability through asymmetric payoff structures. This represents a different statistical regime.
However, in systems that explicitly claim predictive capability, the absence of transparent performance measurement introduces a logical inconsistency.
Within our framework, win rate is treated as the primary diagnostic indicator, as it reflects whether market structure is being consistently and correctly interpreted prior to execution.
Detection precedes optimization. Without detection, optimization has no meaningful foundation.
Summary
Financial markets allow for a wide range of approaches, including those that are not dependent on high win rates for profitability. Nevertheless, win rate remains one of the core statistical descriptors of directional accuracy.
Why is win rate useful?
When the objective is to evaluate whether market direction was correctly identified prior to execution, win rate provides a direct and verifiable measure of predictive accuracy — provided it is computed over a sufficiently large and statistically meaningful dataset.
Why does this matter?
If a system operates under the assumption that future price movement can be anticipated, then the frequency of correct directional predictions becomes a direct test of that assumption.
Only sufficiently large samples — typically tens to hundreds of observations at minimum — allow for meaningful statistical interpretation. If observed accuracy significantly exceeds random baseline levels (for example, 60/40 rather than 50/50), this indicates the presence of a measurable edge.
However, this observation alone does not guarantee profitability.
It does, however, indicate that some form of informational structure may be present in the decision process.
In other words, if repeated application of a methodology produces accuracy meaningfully above randomness, then it suggests that the system is not purely stochastic. The win rate, in this sense, becomes a proxy for detecting structured signal within noise.
In the next section, we will analyze why this metric plays a central role in our framework, particularly in relation to the behavior of our AI system and its statistical evolution over time.